X
myLot
redyellowblackdog
•
@redyellowblackdog
(10629)
• United States
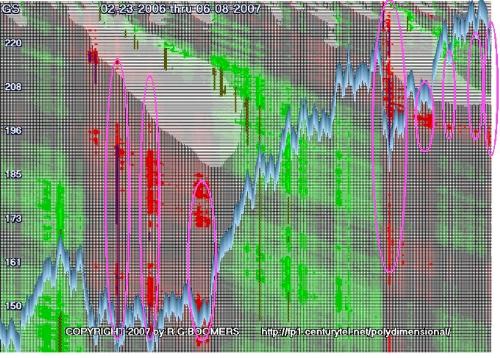
GS PolyDimensional chart - Chart showing status of 1 & 2 estimated derivatives of trend for hundreds of intervals simutanously while also displaying over bought / over sold. Purple ellipses encircle red 2d estimated derivatives and over sold indicators showing the forming of 'bottoms' in the stock price.