Explore
Top Rated Discussions
Most Recent Discussions
Most Recent Activity
Hot Discussions
New User Discussions
Discussions w/ No Response
Help
FAQ
Earnings Program
Community Guidelines
Contact
Sign Up!
Log In
Search
Tagged Discussions
Tagged Responses
Tagged Comments
Tagged All Activity
Users
Full Text Discussions
Full Text Responses
Full Text Comments
Full Text All Activity
X
djia
Tagged Discussions
Do you care that the greatest Dow Jones Industrial Average loss in the history of the world occurred today?
The Horse
@TheHorse
(238349)
•
Walnut Creek, California
27 Feb 20
That blasted virus keeps spreading, albeit slowly, and it's affecting various sectors of the stock market. Airline stocks are down. Hotel stocks are down. Industries that support the above industries are down. Chip making stocks...
money
djia
investments
crash
correction
15 responses
•
13 people
How ol' DOW JONES voted!
redyellowblackdog
@redyellowblackdog
(10629)
•
United States
22 Feb 09
Yes, it is true. One could consider ol'DOW JONES to be a person. One could consider that even though he does not literally speak, we might infer from his reactions how he would have voted in the last Presidential election. Here...
djia
dow jones
dow jones industrial average
obama
stock market
6 responses
•
3 people
Could the DJIA dip into the 4000's?
redyellowblackdog
@redyellowblackdog
(10629)
•
United States
11 Feb 09
Yes, it is true. At least one other market analysist now believes the DJIA could descend even further. 4000 is now possible on the DJIA. Here's one expert's opinion and...
djia
economic crisis
insolvent banks
obama
3 responses
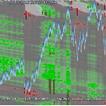
How LOW could it go? The DJIA's downward path.
redyellowblackdog
@redyellowblackdog
(10629)
•
United States
15 Oct 08
Yes, it is true. There is continuely research going on as to how to predict the stock market. The attached chart is an experimental projection using a mathematical model that utilizes crude oil prices as a leading indicator for...
1 year projection
chart
crude oil
djia
leading indicator
1 response
djia 8000 ?
redyellowblackdog
@redyellowblackdog
(10629)
•
United States
10 Feb 08
Could the DJIA reach a level of 8000 in the next few years? Yes, it could. I personally think that as inflation raises the prices of everything else, it will also raise the price of stocks, but there is a scenario whereby the DJIA...
djia
metatrend
polydimensional
2 responses
•
1 person
DODGED a BULLET?
redyellowblackdog
@redyellowblackdog
(10629)
•
United States
21 Jan 08
US markets may have dodged a bullet on Monday, Jan 21, 2008 by being closed for the Reverand Doctor Martin Luther King's birthday. The markets of our european friends are down about 5% as I write this. You can check their status...
stock market
4 responses
•
3 people
Follow up OPPORTUNITY ALERT!
redyellowblackdog
@redyellowblackdog
(10629)
•
United States
17 Jan 08
Earlier I posted a notice that as the DJIA moved DOWN an opportunity was being created. A chart was posted showing that a 'bottom' was forming in the DJIA. As the 'bottom' gets formed at a lower and lower level, the greater the...
djia
metatrends
polydimensional
1 response
•
2 people
20 YEARS AGO: Black Monday October 19, 1987
redyellowblackdog
@redyellowblackdog
(10629)
•
United States
16 Oct 07
It's been 20 years! I still remember it. Did I lose money on it? No. I sold my stock holdings about 1 week earlier. The stock market was obviously "toppy" and the federal reserve just increased interest rates, "again". That...
black monday
djia
market crash
october surprise
stock market
5 responses
•
2 people